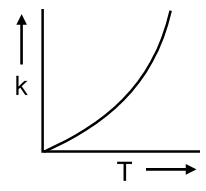
Plots showing the variation of the rate constant (k) with temperature (T) are given below. The plot that follows Arrhenius equation is

The Arrhenius equation describes how the rate constant (k) of a chemical reaction depends on temperature (T). It is given by:
where:
To understand the graphical relationship, we take the natural logarithm of both sides of the equation:
This equation has the form of a straight line, , where:
Therefore, a plot that follows the Arrhenius equation must be a graph of vs. . This plot will yield a straight line with a negative slope.
Looking at the provided options, the correct plot is the one where the y-axis is and the x-axis is , showing a straight line decreasing from left to right.
The plot that follows the Arrhenius equation is the one where ln k is plotted against 1/T, resulting in a straight line with a negative slope. Based on the standard representation of these options, this is most likely the second image from the top.
Arrhenius Equation:
Linear Form:
Slope and Intercept: The slope of the line is , from which the activation energy can be calculated. The y-intercept is equal to .