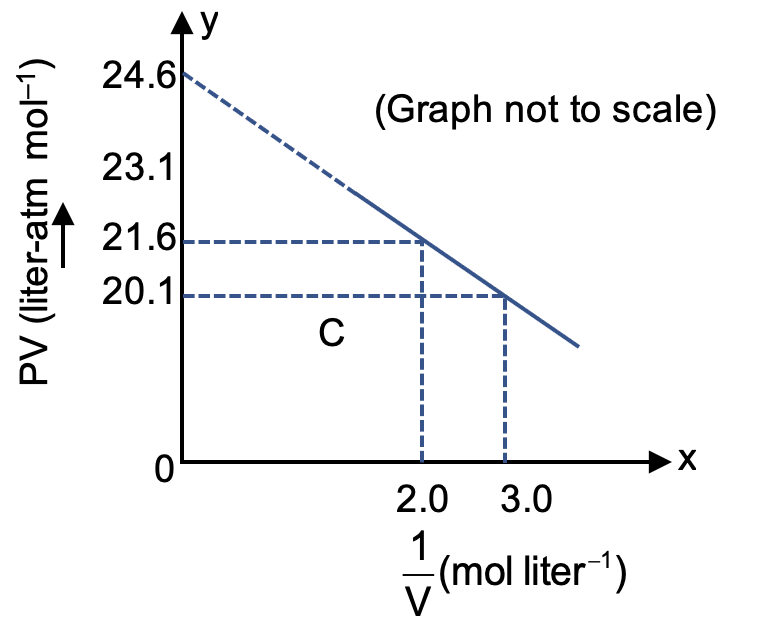
For one mole of a Vander waals gas when b = 0 and T = 300 K, the PV vs 1/V plot is shown below. The value of the Vander waal's constant a (atm. litre2mol–2) is

a = 1.5
We are given a plot of PV vs 1/V for one mole of a van der Waals gas at T = 300 K, with b = 0. We need to find the value of the van der Waals constant a (in atm·L²·mol⁻²).
For 1 mole of gas, the van der Waals equation is:
Given that b = 0, the equation simplifies to:
Which can be rewritten as:
Let's rearrange the equation to express PV in terms of 1/V.
This equation is of the form:
This shows that a plot of PV (y-axis) vs 1/V (x-axis) will be a straight line with:
The equation of the line is: or
The graph of PV vs 1/V is a straight line. We can find its slope to determine the value of 'a'.
From the graph, we can identify two clear points to calculate the slope:
The slope (m) of a line is given by:
Substituting the values from points A and B:
We established that the slope (m) of the PV vs 1/V plot is equal to -a.
Therefore:
Solving for 'a':
The value of the van der Waals constant a is 1.5 atm·L²·mol⁻².
The van der Waals equation is a modified version of the Ideal Gas Law that accounts for the finite size of molecules (parameter b) and the attractive forces between them (parameter a).
For n moles of gas:
Real gases deviate from ideal gas behavior, especially at high pressures and low temperatures. The van der Waals equation is one of the simplest and most famous equations of state that models this real behavior more accurately.
Other equations, like the Redlich-Kwong or Peng-Robinson equations, provide even more accurate models for real gas behavior under various conditions, particularly near the critical point.